Car-Sales-Power-BI
Car Sales Interactive Dashboard 🚗
Project Overview
This Power BI dashboard provides a comprehensive analysis of car sales performance. It tracks key KPIs such as total revenue, profit margins, and sales volume across different regions and car manufacturers.
📊 Dashboard Preview
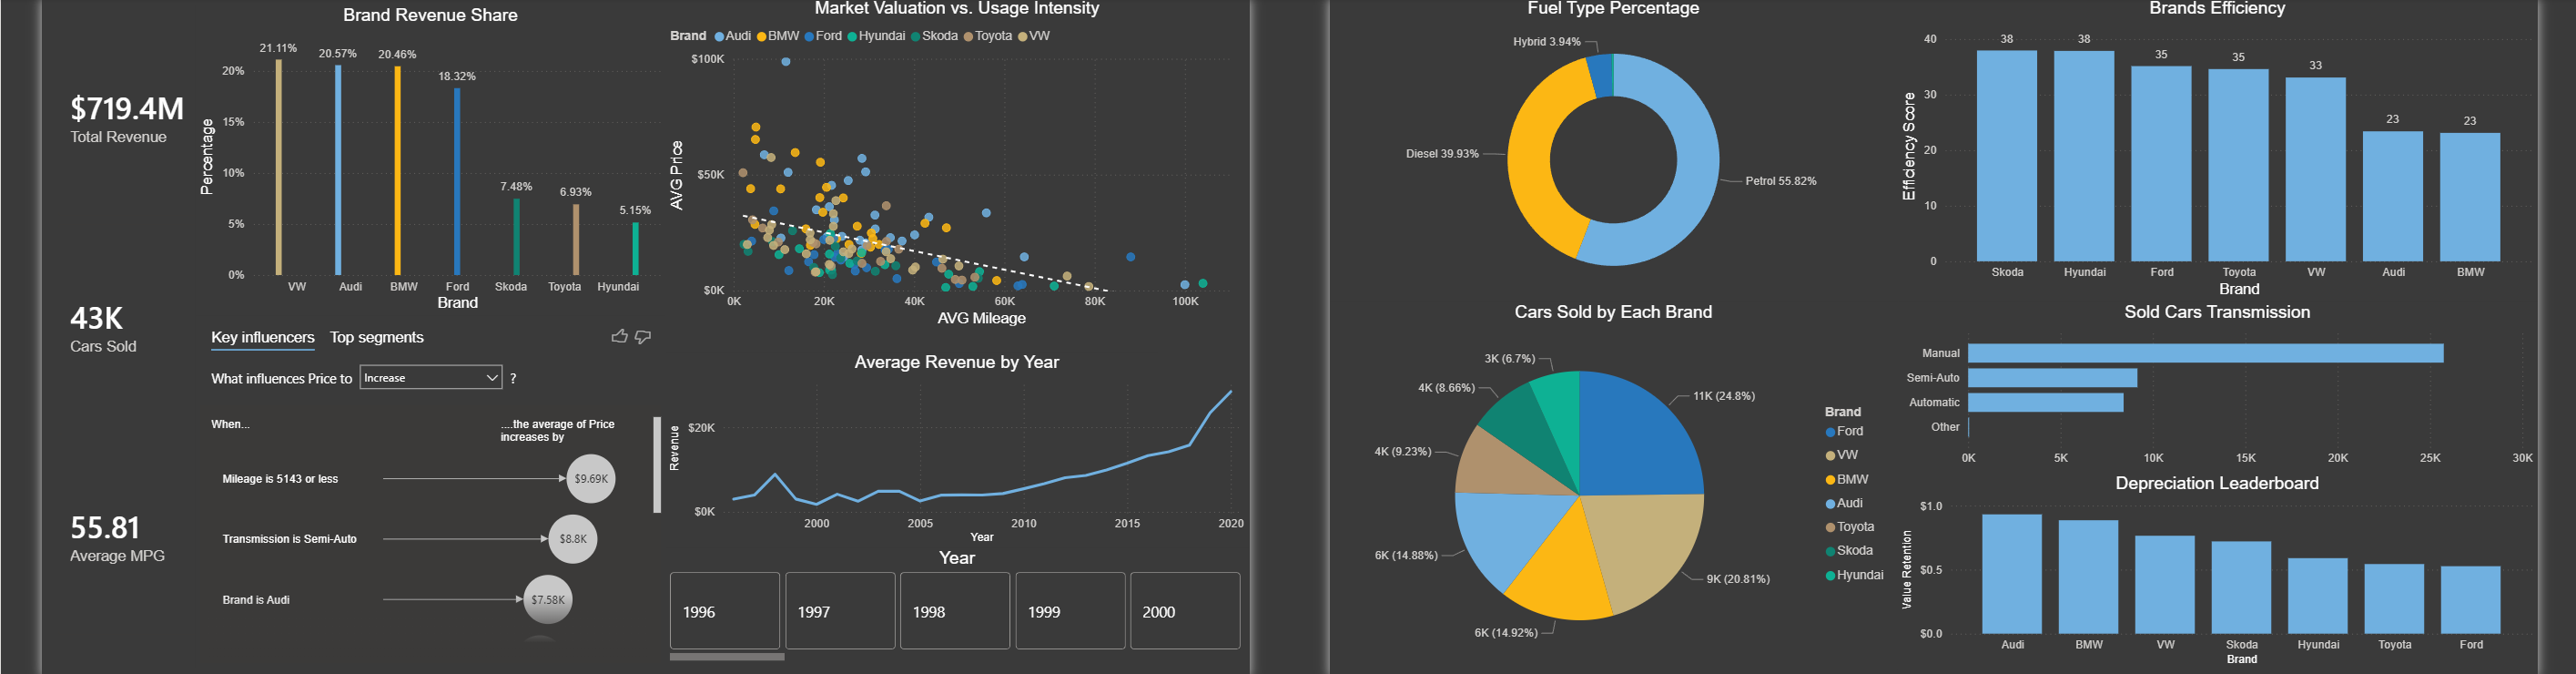
Key Insights
- Sales Growth: Identified a 12% Year-over-Year (YoY) increase in SUV sales.
- Profitability: Analyzed which car models yielded the highest profit margins despite lower sales volume.
- Regional Trends: Found that [Region Name] outperformed others by 20% in Q4.
Technical Skills Used
- DAX: Created custom measures for YoY growth, rolling averages, and dynamic KPIs.
- Power Query: Cleaned and transformed raw sales data (handling missing dates and currency formatting).
- Data Modeling: Established a Star Schema with Fact and Dimension tables for optimized performance.